
Learn More About Layering in Discretionary Income
- Based on Foundation of Anonymous, Direct-Measured Assets
- Translates estimated income, factored asset scores derived from proprietary financial assets database, and life-stage attributes into an index score that ranks households by estimated spending power
- Measures and Ranks Consumer Discretionary Spending Capacity
- Offers a household scoring system that measures and ranks estimated consumer discretionary spending capacity
- Helps marketers discriminate between two households that look the same in terms of income and demographics, but likely have considerably different spending power
- Household-Level Continuous Score
- Provides a household-level continuous score ranging from 1 to 1000, with a rating of 1000 representing households likely to have the most spending capacity
- The higher the DSI score, the higher the likely spending capacity
- Can Be Applied Across the Customer Lifecycle
- Enables financial services and consumer firms to develop appropriate marketing and collections strategies based on a view of discretionary spending capacity
- Easy to Apply
- DSI scores can be appended to any customer or prospect file to identify and target households based on their likely spending capacity
- DSI Script provides high-performance scoring of household spending capacity while addressing internal responsible banking practice issues. If you are interested in this robust discretionary spending capacity information, please contact us
Learn More About Analytic Targeting
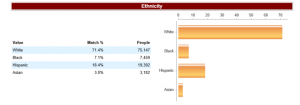
Ethnicity: Numbers reflect the percentage of matched records from the uploaded file and the number of Zones that are targetable in each ethnicity category.
- White: German, English, French, Italian, etc.
- Hispanic: Mexican or South American
- Black: African American
- Asian: Chinese, Japanese or Indian
Number of Children: Numbers reflect the percentage of matched records from the uploaded file and the number of Zones that are targetable in each number of children category.
Genders Present: Numbers reflect the percentage of matched records from the uploaded file and the number of Zones that are targetable in each gender category.
Life Stage: Numbers reflect the percentage of matched records from the uploaded file and the number of Zones that are targetable in each category.
- College Age: Head of Household Age is 18-22 Years Old
- Starting Out: Head of Household Age is 23-30 Years Old
- Career Builder: Head of Household Age is 31-45 Years Old
- Prime Earner: Head of Household Age is 46-64 Years Old
- Retiree: Head of Household Age is 65 or Older
Political Party: Numbers reflect the percentage of matched records from the uploaded file and the number of Zones that are targetable in each Political Party.
Household Income Range: Numbers reflect the percentage of matched records from the uploaded file for each range, the percentage above or below the average of the population in the same location for each range, the number of Zones that are targetable in each range and the number of people within each household income range.
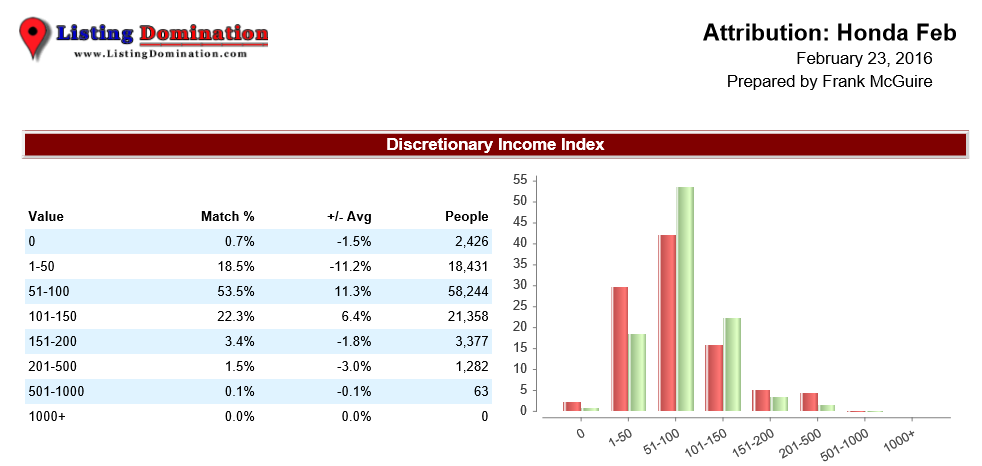
Discretionary Income Index (DII)
Discretionary income indicates the remaining cash flow in a household after necessities have been paid (i.e. rent, utilities, clothing, etc.). An index of 100 represents the national average. An index of 200 equals twice the national average.
Numbers reflect the percentage of matched records from the uploaded file for each range, the percentage above or below the average of the population in the same location for each range, the number of Zones that are targetable in each range and the number of people within those Zones.
The red bars on the graph shows the average of the populations in the same locations.
- DII – “0” Range This group of households usually has annual incomes of under $30,000 and is heavily made up of retirees ranging from 65 to 85 years old who have fixed incomes. A segment of this group is also made up of single and married households who are likely to be in their mid-30s, with one or two children. A majority of the “0” range group live in downscale houses and are not considered to be active investors or savers; in fact they are three times more likely to be over spenders. Their net worth is typically under $50,000 and they have vehicles that rank lowest among all ranges measured.
- DII – “1 to 49” Range: Households in this range have less than the average discretionary income, with 84% earning under $40,000 a year. The “1 to 49” range households are evenly divided between married and single households and are a mix of fixed incomes trending heavily toward retirees 68 years of age and those under 30. These households are less likely to have children and are less likely to have professional or technical jobs. They are less likely to be savers or active investors, and they can be over spenders. The home values in this group cap at $400,000 and many have been in their home for more than 15 years. The little investing that they do is in stocks, savings bonds, IRAs and CDs.
- DII – “50 to 99” Range: The “50 to 99” range can be characterized as the young working class group and contain households with individuals between the ages of 28 and 42. They are often blue-collar tradesmen and 75% of them are homeowners. They are likely to have established families with children and their incomes are most likely to be between $50,000 and $100,000. Those in this range are more likely to have savings and are less likely to be over spenders. Households in this group are consistent with young working class families, and would not be considered active investors; however, they do have IRAs, savings bonds and mutual funds. They are also more likely to be investing in life insurance and driving a vehicle that is in the middle of measurable ranges.
- DII – “100 to 149” Range: The average household has a DII score of “100”, when the household score reaches this level the composition of the household includes incomes of $75,000 to $150,000 and they range in age from 35 to 60 years old. Households in this group are more likely to have one or two children and over 80% are homeowners. Their homes tend to be valued from $250,000 to $500,000 and they tend to have lived in those houses for more than five years. This group of households is financially established and is more likely to have invested assets in IRAs, mutual funds and stocks. They are also more likely to have vacation property and to own a vehicle in the top 30% of value measurements.
- DII – “150 to 199” Range: In the “150 to 199” range approximately 75% of the households earn between $125,000 and $200,000 a year. They are in the core earning years of 40 to 60 years old and many of them have been living in their homes for at least six years. These households contain professionals or self-employed individuals with a net worth of $250,000 to $500,000. These are baby boomer families with invested assets in IRAs, stocks and mutual funds. Those in this group own vacation properties and have higher valued vehicles.
- DII – “200 to 499” Range: The households in the “200 to 499” range have more money to spend on their lifestyles, homes and their investments, and they spend actively. Most in this range have completed college and a high percentage have also completed graduate school. They tend to be in the age ranges of 40 to 60 years old and have incomes consistently above $150,000, while 40% in this range make more than $200,000 a year. Despite their spending, they are not over spenders and regularly save their money by investing in stocks, IRAs and mutual funds.
- DII – “500 to 999” Range: Households in this range have professional or technical individuals and they have a higher than average educational background. Those in this range are 45 to 65 years old and 70% of them are married. Incomes in this range can be found in two pockets, $150,000 to $300,000 and over $500,000 a year, with the higher percentage of incomes being over $500,000. These households own homes worth at least $500,000, but the values range up to $5 million. Of those in this group, 80% have a high level of invested assets in IRAs, mutual funds and stocks while they avoid investing in CDs and savings bonds. More than 80% of this group are likely to invest in vacation property, own top scale vehicles and 50% of them have a net worth over $2 million.
- DII – “1000 ” Range: Reserved for the very wealthy, these small percentages of the households earn incomes of over $500,000 to well over $2 million a year. They tend to be between the ages of 50 and 65, to have professional occupations with a focus on financial and medical professions and they typically have college or advanced degrees. Of those in this range, 90% own their own homes that value from $1 million to $10 million. These households are likely investors with assets in stocks, mutual funds and IRAs. They have the top net worth, while being heavy donators to charities.
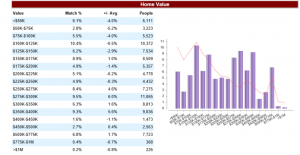
Home Value Estimate: Numbers reflect the percentage of matched records from the uploaded file for each range, the percentage above or below the average of the population in the same location for each range, the number of Zones that are targetable in each range and the number of people within each home value estimate range.
The red line on the graph shows the average of the populations in the same locations.
Net Worth: Indicates range of household’s net worth using income, asset, life stage and other financial model components.
Invested Asset Decile: Decile ranking of a households Investable assets using a combination of income, location, & life stage components – (1 = highest, 10 = lowest)
Charitable Contributions: Decile ranking of a household’s charitable contributions (1 = most, 10 = least)
Auto Consideration Set: Indicates the likelihood of an individual owning one of 11 categories of vehicle such as an SUV, coupe, foreign sedan, or compact car.
Percentages shown for each category represent how much of the selected/uploaded audience are in the Top 5 Deciles for each auto category, where decile 1 = the most likely to own that type of vehicle and 10 = the least likely. Therefore, the percentages shown are only for those who are likely to own a vehicle in that auto category.
Social Matrix: Provides a breakdown of the matched records in the uploaded file to 24 unique population segments. Each segment is a compilation of age, affluence, discretionary income and life style. Each record has a location associated with it which has a percentage of the population that it matches within the social matrix segment.
Numbers reflect the percentage of matched records from the uploaded file for each range, the percentage above or below the average of the population in the same location for each range, the number of Zones that are targetable in each segment and the number of people within each net Social Matrix segment.
The spider chart shows the indexing of each segment for the uploaded/selected audience. The shaded red areas represent the averages of the same locations as the uploaded/selected audience.
Generation Y – Starting Out
- Timecards & Happy Hour – 18-25 year olds working wage-rated jobs, with a lifestyle that is more focused on personal entertainment than building a substantive career.
- Learning the Ropes – 18-25 year olds, just out of college and recently introduced into the work force
Generation Y – Building Bright Futures
- Urban Yuppies – 26-39 year old city dwellers, just launching into their career and enjoying the luxuries of the city
- Career & Family Roots – 26-39 year olds focused on bettering their career and building a stable long-term family unit
- Paycheck Planners – 26-39 year olds living paycheck to paycheck
Baby Busters – Established Patterns
Woodstock Generation – Executing the Plan
- Day to Day Challenges – 52-64 year olds with mid-low level careers and have to deal with day to day challenges to get by.
- Luxury Lifestyles – 52-64 year olds living luxurious lives due to high paying professional jobs and greater disposable income.
- Comfortable Independents – 52-64 year olds living comfortably. Considered above average in affluence but do not spend on extravagant items.
- On Approach – Low ITA – 52-64 year olds, preparing to approach retirement. Low ITA’s due to below average asset accumulation and limited financial planning
- Tax Free Savers – High ITA – 52-64 year olds who have invested wisely over the years. They have a long term plan for retirement and assets to meet that plan.
Early Boomers – Enjoying the View
- BigBox Greeters – Low ITA – 65-73 year olds with limited cash flow and low credit availability. May be working menial jobs to supplement their cash flow in retirement.
- Solid & Slow – High ITA – 65-73 year olds living a comfortably, but modest, retirement after having worked hard and planned well. This is reflected in their high ITA.
- Public Links & Projects – Low ITA – 65-73 year olds who are enjoying retirement, however, their resources are limited and spending activity is cautious
- Pace & Protection – High ITA – 65-73 year olds interested in maintaining their lifestyle and protecting the wealth and assets they’ve built up over the past few decades
- Country Club Snow Birds – 65-73 year olds living comfortably luxurious lives with an interest in participating is social activities with peers.
Greatest Generation – Modest Futures
Top Home and Business Zones
Top Home Zones
Each IP Address has a primary designation of Home, Business, Education, Government, or Wireless User. This page shows the top fifteen home zip code locations, determined by the frequency of matches to the uploaded file. The number of matches combined with Home IP Addresses determines the priority in the list.
A map showing concentrated areas is also shown for the top home state.
Top Business Zones
Each IP Address has a primary designation of Home, Business, Education, Government, or Wireless User. This page shows the top fifteen business zip code locations, determined by the frequency of matches to the uploaded file. The number of matches combined with Business IP Addresses determines the priority in the list.
A map showing concentrated areas is also shown for the top home state.

Our custom Auto Buyers Analytic (ABA) script evaluates your site visitors by the current make, model, year, ownership, life stage and affluence of prospective buyers visiting your site. We also screen non site visitors in proximity of 11,000 car dealers with the same data. Once identified, we geo zone and rank the qualified buyers based on historic media activity in categories like auto, insurance and finance. Recent activity in select categories can be an indicator that buyers are in the market. We connect the dots on car buying behavior and generate maximum qualified reach to in the market buyers. We use our data to target based on buyers in the market and what they own for trade in. We also collect this data on your site, segment and target your visitors based on what they are driving.

With our expertise, we target and segment in the market buyers who drive older models of the cars listed below. We target them with easy button type trade-in messaging for the car they are currently driving. We do this by placing the right ad at the right time, encouraging buyers to trade quality for quality. This gives you the opportunity to get in front of every buyer considering a competing model in your geo area every month. Rinse wash and repeat each month. This is just one tactic of many we implement for our dealers.
Key competitors for targeting
- Ford Fusion
- Hyundai Sonata
- Nissan Altima
- Toyota Camry
Secondary models worth targeting.
- Chevy Malibu
- Kia Optima
- Mazda 6
- Volkswagen Passat

Buyer who owns an older Toyota Camry and is in the market for a new car. We know this through our proprietary script and DSP. We have them trip over reviews of people who owned a Toyota and traded-in for a Honda. We develop 5 differentiators to the dealership and model and drive home the what’s in it for them to get more buyers walking through your doors lifting any model in the dealership.

Buyer who owns an older Nissan Altima and is in the market for a new car. We know this through our proprietary script and DSP. We have them trip over reviews of people who owned a Nissan and traded-in for a Honda. We develop 5 differentiators to the dealership and model and drive home the what’s in it for them to get more buyers walking through your doors lifting any model in the dealership.

Buyer who owns an older Hyundai Sonata and is in the market for a new car. We know this through our proprietary script and DSP. We have them trip over reviews of people who owned a Hyundai and traded-in for a Honda. We develop 5 proprietary differentiators to the dealership and model and drive home the what’s in it for them to get more buyers walking through your doors lifting any model in the dealership.

Q: How do you know the model and year car a site visitor is driving?
We are harnessing the power of Big Data by making it actionable. Our ABA script tracks not only where your visitors go but where they’ve been. Every key stroke on your computer is logged and added to your on-line profile. We have written a very complex algorithm that mines this data and connects the dots to the car they are driving and the age.
Q: Does your ABA script get blocked by ad blockers?
No, our script is not detected by ad blockers. We are able to track 100% of your site visitors and all there devices. Traditional pixel scripts and cookie bombs are blocked by ad blockers. 30-50 percent of your site visitors are blocking your cookie; we fix that and collect 100%.
Q: Can you do this with any dealership?
Yes, Honda is used as a case study. We have done this with other types of dealerships with the same success.
Q: What is the cost to get the ABA script?
We only provide the script to our retargeting clients and there is no additional charge for the script it’s part of our service.
Q: Who provides the ads?
In most cases we do the art work however, we are happy to work with in house graphic design people if needed. We have a 90 minute process where we identify your competitors weakness and your strengths. We develop five differentiators with all the psychological triggers needed to give great lift.
Q: Is your ABA script proprietary?
Yes it is and so is the algorithm we use to connect the dots.

Facebook
Youtube
LinkedIn